MARKET UPDATE: The Hypersonic Shock: When a Carrier Takes a Hit and the Tape Reprices the World

REPUBLISHING: Originally published February 22, 2026
(CryptoSAZZ Macro Projection Brief — NDX, Bitcoin, Gold, Crude)
The four charts you’re looking at are telling the same story in different languages. Blue is what the market just lived through. Green is the model’s fitted “shadow path” (how the structure has been tracking). Orange is the projection curve where price pressure wants to go next if the current regime persists.
Now introduce a regime-break catalyst: Iran takes out (or severely damages) a U.S. aircraft carrier with a hypersonic missile. That’s not “another headline.” That’s an institutional event and one that forces immediate repricing of risk premia, supply chains, retaliation ladders, and the credibility of deterrence itself.
In that kind of moment, markets don’t trade fundamentals, they trade reflex:
- oil and shipping insurance gap up,
- equities gap down,
- gold gaps up,
- crypto gets two-way violent (risk-off liquidations first, then “sovereign hedge” narrative later),
- volatility becomes the asset.
Let’s walk through what the projections are implying, and how a carrier strike could accelerate (or temporarily distort) each path.
1) Crude Oil (Orange says: grind higher… then panic spike)
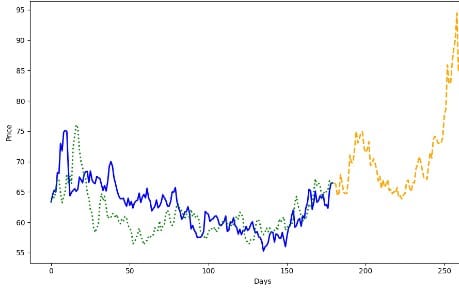
The crude oil projection is the cleanest “geopolitical premium". After basing in the ~$60–$70 zone (blue), the orange path lifts into the mid-$70s and then ramps toward the ~$90–$95 area.
A carrier strike compresses timelines. The market doesn’t wait for barrels to go missing, it prices the probability that barrels might go missing:
- disruption risk in the Strait of Hormuz,
- attacks on infrastructure / terminals,
- escalation into shipping corridors,
- sanctions responses and counter-responses,
- immediate repricing of insurance and freight.
Translation: if this scenario occurs, the “slow lift” portion of the orange line can collapse into days, and the spike becomes more plausible and more vertical. Oil is the first domino and once it moves, it drags inflation expectations, rates, and equity multiples with it.
CryptoSAZZ takeaway: crude is the macro ignition source in this shock.
2) Gold (Orange says: breakout continuation, melt-up risk)
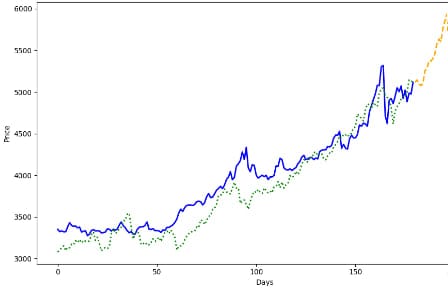
Gold’s blue line is a persistent climb with higher highs, and the orange projection continues that trajectory into the upper ~$5,000s. In a carrier-strike scenario, gold becomes the purest expression of:
- safety demand,
- reserve hedging,
- “policy error” risk,
- currency debasement expectations (if the response path implies sustained defense spending + supply shock inflation).
Gold also has something crypto lacks in the first 24–72 hours: it is not typically forced-sold to meet margin the way crypto often is.
Translation: gold tends to behave like a clean hedge at the exact moment the world is unsure what’s next.
CryptoSAZZ takeaway: if the shock happens, gold is the “bid that doesn’t blink,” and the projection is already leaning that way.
3) NDX (Orange says: drawdown and unstable rebound structure)
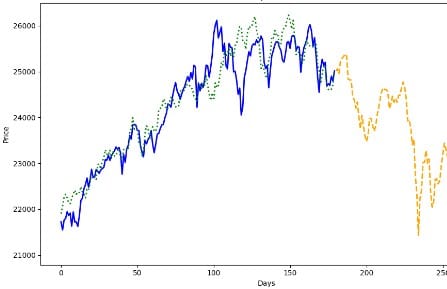
The Nasdaq-100 projection is not a happy chart. After a strong run (blue), the orange path shows a decline into the low-to-mid 23k region, and then a sharper air-pocket toward ~21.5k before a choppy rebound attempt.
That’s exactly the kind of structure you get when:
- volatility rises,
- liquidity thins,
- forced de-risking hits crowded positioning,
- multiples compress as the market reprices “higher-for-longer” risks tied to energy/inflation,
- geopolitical uncertainty causes real-money and systematic flows to de-gross.
A carrier strike amplifies the multiple compression channel because it injects:
- unpredictable policy paths,
- potential cyber spillover risk,
- renewed supply-chain fragility,
- and the possibility of broader regional conflict.
Translation: NDX is the “risk premium sponge.” In this scenario, it absorbs fear.
CryptoSAZZ takeaway: the orange projection reads like “fragile highs → volatility regime → deeper drawdown risk.”
4) Bitcoin (Orange says: post-crash chop with upside spikes, but unstable)
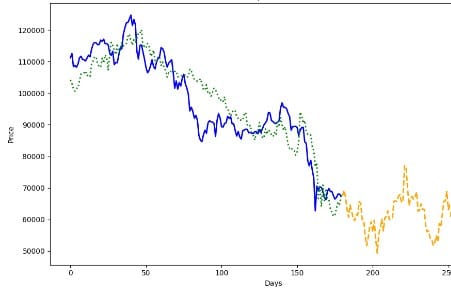
Bitcoin’s blue line shows a sharp, structural drawdown from the highs into the mid-$60k area. The orange path implies a volatile range with dips into the ~$50k zone and fast upside spikes into the ~$70k–$75k neighborhood, followed by renewed chop.
This is important: Bitcoin is not one asset in a shock. It is two assets in sequence.
- Phase 1 (Immediate shock): “risk asset” behavior dominates. Leverage gets cleared. Correlations go to 1. BTC can dump simply because it’s liquid and trades 24/7.
- Phase 2 (Narrative re-anchor): once forced selling finishes, Bitcoin can flip into “sovereign hedge / capital flight / neutrality premium” especially if the shock threatens trust in institutions, payment rails, or regional stability.
That’s why the projection looks like whipsaw. It’s the correct signature for an asset that is both:
- a high-beta liquidity release valve, and
- a long-duration trust hedge.
CryptoSAZZ takeaway: the orange BTC path screams “violent two-way tape”, not a straight line.
The Carrier-Strike Macro Chain Reaction (Why these four charts rhyme)
If Iran lands a hypersonic hit on a U.S. carrier, the market immediately reprices four things:
1) Energy risk → inflation impulse
Oil up isn’t just oil up. It’s headline CPI psychology, freight costs, supply uncertainty, and profit margin stress.
2) Inflation impulse → rates/real yields uncertainty
Even if growth risks rise, a supply shock can keep central banks boxed in.
3) Rates uncertainty → equity multiple compression
High duration assets (NDX) get punished.
4) Trust/fragmentation impulse → gold + BTC bid (after liquidation)
Gold leads early. BTC follows once positioning clears.
This is exactly what the projections hint at:
- Oil wants higher, potentially explosive.
- Gold wants higher, potentially trending.
- NDX wants lower, potentially disorderly.
- BTC wants volatile range with tradable spikes.
Practical Implications for CryptoSAZZ Readers (Positioning logic, not financial advice)
If this shock happens, expect “three waves”:
Wave A: 0–72 hours — liquidation & gaps
- NDX down hard (risk-off)
- BTC down first (leverage purge)
- Gold up
- Oil up violently
Wave B: 3–14 days — policy + retaliation pricing
- Oil stays bid if shipping risk persists
- Gold stays firm
- NDX struggles (volatility + earnings multiple hit)
- BTC starts carving a bottom if liquidation ends
Wave C: 2–12 weeks — regime settles
- If conflict escalates / shipping impaired: oil and gold trend, equities remain pressured, BTC gains “neutral asset” premium.
- If de-escalation is credible: oil mean reverts, NDX rebounds, BTC can still rally but with “risk-on” correlation.
The key CryptoSAZZ edge:
Don’t predict the headline. Trade the regime.
- The orange lines are regime continuations.
- The carrier strike is a regime accelerant.
What to Watch (the “tell” signals)
- Oil gap + follow-through (not just a spike): confirms persistent risk premium.
- Gold holding gains on equity bounce attempts: confirms deeper uncertainty.
- NDX failing to reclaim prior highs quickly: confirms multiple compression regime.
- BTC behavior after the first flush: if BTC can stop making new lows while equities remain weak, that’s the “hedge narrative” phase beginning.
Bottom Line
These projections collectively describe a world where:
- Energy risk rises (crude up, potentially sharply),
- the safety bid strengthens (gold up, trending),
- equity risk premium expands (NDX down, unstable),
- Bitcoin becomes a battleground asset (down first, then tradable upside spikes as the market reassigns it from “risk-on” to “neutral hedge”).
If the carrier strike scenario occurs, it doesn’t invalidate the projections, it compresses the timeline and increases the amplitude. In other words: the orange paths don’t disappear. They get louder.
✍️ By The CryptoSazz Markets Desk
The content provided on CryptoSazz is for informational and educational purposes only and does not constitute financial, investment, trading, or other advice. Nothing on this site is a recommendation or solicitation to buy or sell any financial asset or to adopt any investment strategy.
CryptoSazz may discuss market trends, macroeconomic developments, and quantitative trading models; however, these are intended solely to share insights and analysis and are not tailored to your specific financial situation or investment objectives.
While we strive to ensure the accuracy and timeliness of the information presented, CryptoSazz makes no warranties or representations regarding its completeness or reliability. All opinions expressed are subject to change without notice.
Cryptocurrencies, DeFi protocols, and digital assets involve significant risk, including the potential loss of principal. You should conduct your own research and consult a qualified financial advisor before making any investment decisions.
Past performance is not indicative of future results.