(FREE) CryptoSazz Roundup - Iran/Israel - Potential Severe Escalation Brewing ??

Highlights of recent LinkedIn posts for our valued subscribers.
1) June 17, 2025
The Invisible Signals of Crypto’s Geopolitical Sensitivity
What if the next Bitcoin move isn’t driven by ETFs, halvings, or on-chain flows, but by war risk, rate dislocations, or defense market shocks?
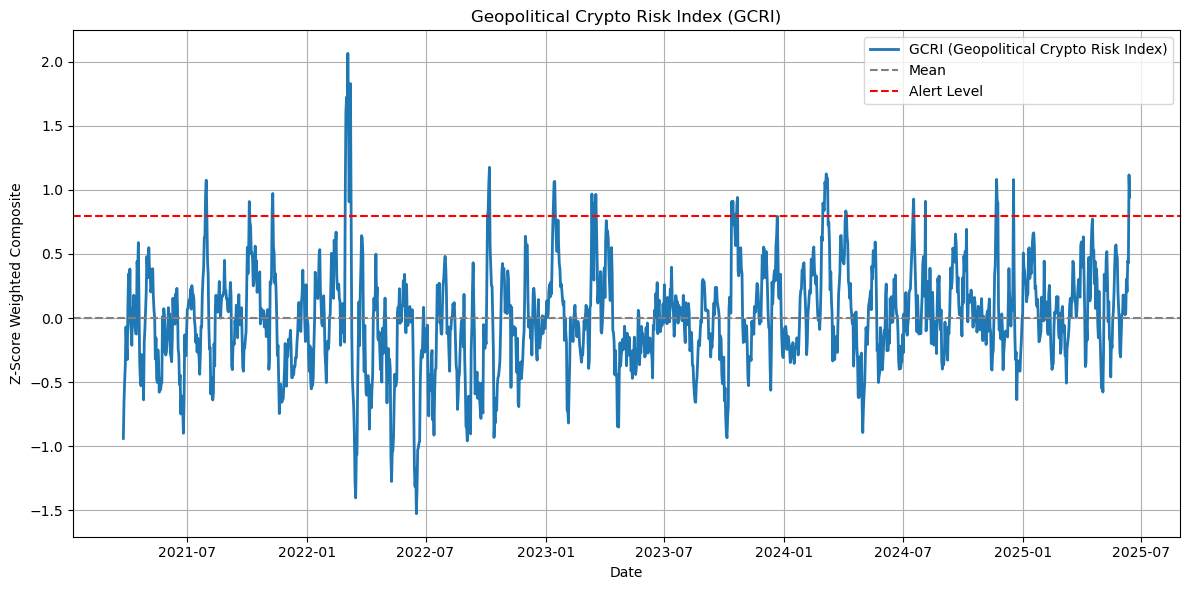
At CryptoSazz, we track the Geopolitical Crypto Risk Index (GCRI) — a real-time, z-scored composite of:
-Oil shocks
-Gold bid strength
-VIX panic
-Treasury volatility
-Defense sector flows
-BTC reflexivity
The chart below shows every GCRI spike greater than an alert level, signaling heightened macro risk with direct spillover into crypto markets. We’ve found these spikes often precede Bitcoin volatility, regime shifts, or liquidity squeezes. Most importantly: GCRI helps us distinguish headline noise from market-signaled escalation. At CryptoSazz, we want to decode crypto’s geopolitical pressure points before the crowd does?
2) June 15, 2025
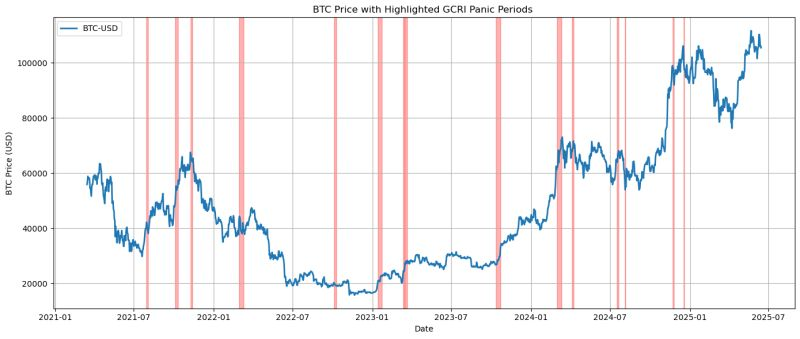
What if Bitcoin could see global panic—before the headlines did?
The chart below highlights every time our Geopolitical Crypto Risk Index (GCRI) breached a +2 standard deviation panic threshold, and stayed elevated until risk normalized.
Red zones = systemic fear.
BTC = truth in price action.
What we’ve found:BTC often leads or reacts reflexively to macro dislocations.
GCRI panic zones have preceded major regime shifts, from war rumors to Fed pivots. In many cases, BTC sold off early, but reversed faster than traditional assets.
At CryptoSazz, we don’t chase narratives , we track stress signatures across Gold, Oil, VIX, Bonds, Stablecoins, BTC on-chain flows, and Cross-market volatility regimes.
We believe this type of signal is how institutional crypto investors will manage macro risk in the coming cycle.
3) June 11, 2025
When oil panics, Bitcoin responds.
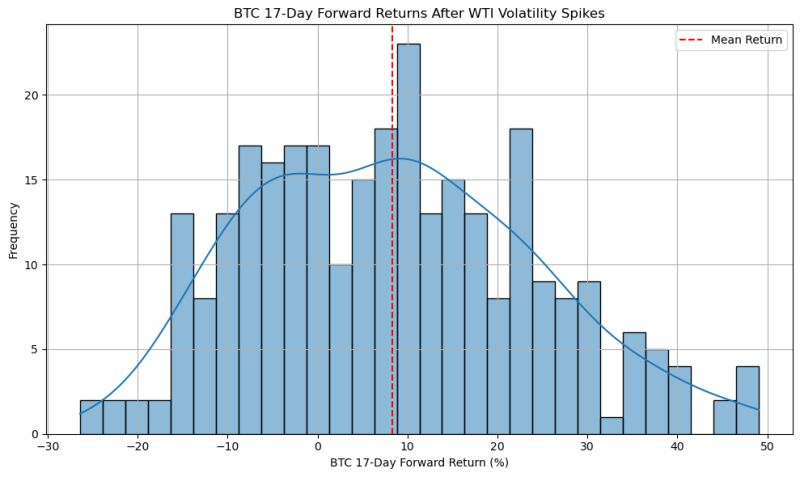
We ran a strategy backtest to see what happens when WTI crude volatility spikes — the kind that signal geopolitical stress, inflation anxiety, or a shake-up in the petrodollar system.
The result? When oil volatility jumps >1.7× its median level, BTC returns over the next 17 days average +9%, with a strong skew toward gains.
This histogram shows the distribution of BTC’s 17-day forward returns after these oil volatility shock events.
The takeaway: Energy volatility is more than macro noise — it's a directional signal for crypto risk appetite.
✍️ By CryptoSazz Research Team
The content provided on CryptoSazz is for informational and educational purposes only and does not constitute financial, investment, trading, or other advice. Nothing on this site is a recommendation or solicitation to buy or sell any financial asset or to adopt any investment strategy.
CryptoSazz may discuss market trends, macroeconomic developments, and quantitative trading models; however, these are intended solely to share insights and analysis and are not tailored to your specific financial situation or investment objectives.
While we strive to ensure the accuracy and timeliness of the information presented, CryptoSazz makes no warranties or representations regarding its completeness or reliability. All opinions expressed are subject to change without notice.
Cryptocurrencies, DeFi protocols, and digital assets involve significant risk, including the potential loss of principal. You should conduct your own research and consult a qualified financial advisor before making any investment decisions.
Past performance is not indicative of future results.